
Building Meta-Analysis Datasets with AI Assistance: A Case Study. PART 3: Using Sysrev for Title and Abstract Screening and Data Extraction
- bob.reed
- Mar 17
- 12 min read
NOTE: This blog is coauthored with Anne Jayasekara and Weilun (Allen) Wu
Introduction
This is the third blog in a series on how AI can assist in assembling datasets for meta-analyses. The first blog described how ChatGPT was used to develop a systematic literature search strategy for studies on the relationship between inflation and subjective well-being. The second blog described how that search strategy was executed across four bibliographic databases — Scopus, Business Source Complete, SSRN, and RePEC — and how the resulting 361 unique records were organized in Zotero and prepared for screening. This blog picks up at that point.
At the end of the previous blog, the 361 records had been exported from Zotero as an RIS file and uploaded to Sysrev, a web-based platform designed to support systematic reviews and meta-analyses. This blog describes what happened next: how two research assistants (RAs) — a PhD student (Anne) and a postdoc (Allen) — independently used Sysrev's AI-assisted tools to conduct title and abstract screening and data extraction. Their experiences, including both their successes and their failures, offer some practical lessons about what AI-assisted reviewing can and cannot do reliably.
I should mention at the outset that the title and abstract screening results reported below were actually from our second attempt. We had previously selected 84 of the 361 titles and abstracts (23%) for further analysis. We now wanted to see whether Sysrev would be able to replicate our manual results. In the first attempt, the training samples had too few “included” studies for Sysrev to reliably select them. In the second attempt, I overrepresented “included” studies in the training samples so that every batch of 30 had 12 “included” studies (40%). This greatly improved Sysrev’s ability to sort “included” from “excluded” studies.
As before, most of the content in this blog was generated by Claude.ai. I provided Claude with the instructions given to Anne and Allen, the results they obtained, and their individual reports describing what they did. Claude then integrated these materials into a blog post, which the three of us—Anne, Allen, and I—subsequently reviewed and lightly edited.
What is Sysrev?
Sysrev is a web-based platform designed to facilitate collaborative systematic reviews and meta-analyses. Its core functionality supports structured screening of titles and abstracts, full-text review, and data extraction. One of its distinguishing features is an AI-assisted auto-labeling tool, which uses prompts written by the reviewer to classify records or extract information from full texts. Reviewers write natural-language prompts describing their inclusion and exclusion criteria, and Sysrev applies those prompts to the uploaded records using it's LLM integration via API with GPT or Gemini. For their work, Anne and Allen used Gemini 2.5 Flash.
The workflow used here had two distinct stages. In the first stage, Anne and Allen used Sysrev's auto-labeler to screen the 361 uploaded records by title and abstract. They then compared how well Sysrev matched their own screening decisions. In the second stage, a subset of studies that had already been manually coded by the students (the "ground truth" papers) were used to evaluate how well Sysrev's auto-labeler could extract numerical data from full texts. Both stages required Anne and Allen to develop, test, and iteratively refine prompts.
Title and Abstract Screening
The task and how it was set up
Before applying Sysrev's auto-labeler to the full set of 361 records, Anne and Allen were asked to develop and validate their prompts using a series of practice datasets. Each practice dataset contained 30 studies for which the correct inclusion or exclusion decision was already known — the "ground truth" established by human review. The RAs worked through three sequential practice datasets. The objective was to write a prompt that maximized balanced accuracy, defined as the average of the true positive rate (TPR) and the true negative rate (TNR):
Balanced Accuracy = (TPR + TNR) / 2
Balanced accuracy was chosen rather than simple overall accuracy because the included and excluded categories were not equally represented. A prompt that classified everything as an exclusion would achieve high overall accuracy simply by virtue of the fact that most of the studies in our sample were irrelevant for our purposes. Balanced accuracy penalizes that kind of naive behavior by giving equal weight to performance on each class.
The process was explicitly iterative. The RAs were instructed to develop their best prompt on Practice 1, then test it on Practice 2, revise if necessary, and then recheck their revised prompt against Practice 1 before moving on to Practice 3. After finalizing their prompt across all three practice datasets, they applied it to the remaining 271 records that had not been part of the practice exercises.
Both RAs used ChatGPT to assist in drafting and refining their prompts, but they worked entirely independently. They were explicitly instructed not to communicate with each other about their prompts or strategies. The goal was to see whether two reasonably careful researchers, working from the same instructions and the same platform, would arrive at similar results.
Allen's approach and results
Allen's initial prompt focused on three core inclusion criteria: the outcome variable had to measure subjective well-being (such as life satisfaction or happiness); inflation or a closely related measure (such as the CPI or cost of living) had to appear as an explanatory variable; and the study had to be quantitative and empirical. He also added basic exclusion rules: studies where well-being was not the outcome, studies where inflation was the dependent variable, and conceptual or descriptive rather than empirical studies.
After applying this initial prompt and comparing Sysrev's classifications against the human-coded ground truth, Allen identified specific misclassifications and revised the prompt with ChatGPT's assistance. The most substantive revision was relaxing the requirement that inflation be the primary independent variable, clarifying instead that studies should be included when inflation appears as a macroeconomic control variable in a regression where well-being is the outcome. He also added rules to exclude studies that mentioned inflation only as background context rather than as part of the empirical model, and to exclude studies focused on inflation perceptions or attitudes toward inflation unless those variables clearly appeared as predictors of well-being.
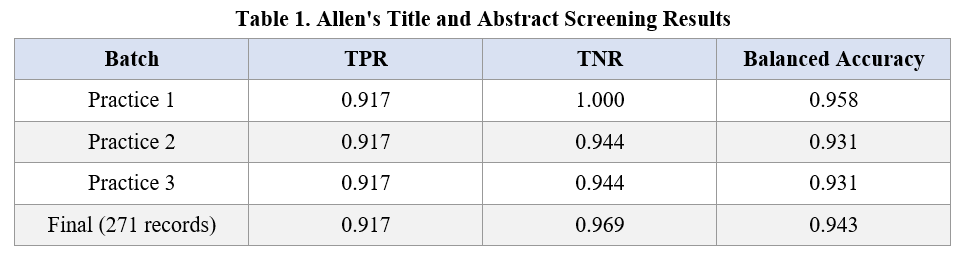
Allen's results are shown in Table 1. His balanced accuracy was strong across all practice rounds, ranging from 0.931 on Practices 2 and 3 to 0.958 on Practice 1, and settling at 0.943 on the final application to the full 271-record set. His TPR ("True Positive Rate") was consistently around 0.917 throughout, meaning he correctly identified nearly all of the true inclusions. His TNR ("True Negative Rate") was 1.000 on Practice 1, 0.944 on Practices 2 and 3, and 0.969 on the final run. The result was a well-balanced prompt that performed creditably on both sides of the inclusion/exclusion boundary.
Anne's approach and results
Anne's approach was more aggressive from the outset in specifying exclusion criteria. Like Allen, she required that the predictor variable be an objective measure of inflation (such as CPI, HICP, or the inflation rate), that the outcome reflect global subjective well-being (measured through indicators such as life satisfaction or happiness), and that the study be empirical and quantitative. But she also used ChatGPT to help her identify and close a series of boundary cases that her initial prompt handled incorrectly.
Several of these boundary cases are instructive. The word "inflation" did not always refer to price inflation: in some cases it signaled inflation expectations, perceived inflation, experiential inflation, or even statistical inflation. The abbreviation "CPI" was sometimes identified by Sysrev as the Corruption Perceptions Index rather than the Consumer Price Index. And many papers that used the term "well-being" or "satisfaction" were discussing job satisfaction, pay satisfaction, or customer satisfaction — domain-specific measures that did not meet the inclusion criteria. Anne responded to each of these failures by tightening her prompt: adding hard exclusion criteria for domain-specific satisfaction outcomes, requiring that inflation appear as an objective macroeconomic variable rather than a subjective perception, and adding a macro-context inclusion rule for multilevel or cross-country studies where inflation was included alongside other macroeconomic variables in a global well-being model.
Anne's results are shown in Table 2. Her performance was strong. She achieved 100% balanced accuracy across all three practice rounds — a TPR and TNR both equal to 1.0 — and maintained a balanced accuracy of 97% on the final application to the full 271-record set (TPR 0.98, TNR 0.96). The drop from perfect practice performance to 97% on the final run is itself informative: it suggests that even a well-calibrated prompt will encounter edge cases in a larger, more heterogeneous set of records that were not represented in the practice data.

What explains the difference?
Both Allen and Anne achieved strong screening performance, and it is worth reflecting on the similarities and differences in their approaches. Both RAs were given the same instructions, worked on the same practice datasets, and used ChatGPT to assist in prompt development. Their balanced accuracies on the final run were broadly comparable: 0.943 for Allen and 0.970 for Anne.
The modest difference in their final balanced accuracies (Anne at 0.970, Allen at 0.943) likely reflects Anne's more aggressive approach to specifying exclusion criteria from the outset. Anne identified and closed a series of specific boundary cases — such as "CPI" being misread as Corruption Perceptions Index, or "well-being" capturing job or financial satisfaction — and added hard exclusion rules to address each. Allen's refinements were also careful and systematic, but focused somewhat more on clarifying inclusion criteria, such as when inflation appearing as a control variable should count as a valid inclusion. Both approaches ultimately produced workable prompts, and the difference in their final results was relatively small. The broader lesson is that attending carefully to both false positives and false negatives — and using the practice rounds to diagnose specific failure modes rather than making general improvements — is the key to reliable screening performance.
This suggests a practical lesson for anyone using Sysrev's auto-labeler for title and abstract screening: assuming balanced accuracy is the metric one wants to optimize, achieving it requires attending carefully to both types of error. A prompt that is too inclusive will score well on TPR but fail on TNR; a prompt that is too restrictive will do the reverse. Getting both right requires systematic diagnosis of misclassifications and targeted revision of exclusion criteria, not just inclusion criteria.
Data Extraction
The task and how it was set up
The data extraction task was considerably more demanding than title and abstract screening. Rather than making a binary include/exclude judgment, the auto-labeler was asked to extract specific numerical values from the full texts of included studies — the regression coefficients, standard errors, t-statistics, sample sizes, publication years, and data period start and end years that would eventually populate the meta-analytic dataset.
Anne and Allen first individually, and then together, manually coded 15 papers as their “ground truth”. Five of these papers were used as a training set for prompt development; the remaining 10 served as a held-out test set. The iterative process followed the same general logic as screening: develop a prompt on the first paper, test it on the second, revise as needed, recheck against the first, and so on through Paper 5. After finalizing the prompt on the training set, RAs applied it — without modification — to Papers 6 through 15.
Performance was measured using a custom success rate formula designed to penalize false positives heavily:
Success Rate = Correct Cells / (Ground Truth Cells + False Positive Cells)
The numerator counts cells that Sysrev extracted correctly; the denominator adds all cells in the ground truth to any extra cells Sysrev produced that had no match in the ground truth. This design means that irrelevant coefficients — cases where Sysrev extracted the wrong information — are penalized heavily, as they inflate the denominator without contributing to the numerator. This is the right priority for a meta-analysis where including bad numbers is considered worse than excluding good numbers.
One further methodological decision is worth noting. Because Sysrev often rendered text from papers in ways that differed from the ground truth coding — for example, extracting "Inflation rate (-1)" where the ground truth said "natural rate of inflation lagged one year" — categorical and free-text fields were excluded from the success rate calculation entirely. Only numerical variables were scored: coefficient, standard error, t-statistic, sample size, table row number, table column number, publication year, and the start and end years of the data period.
Allen's approach and results
Allen built 10 child labels in Sysrev, each corresponding to one variable in the codebook. His starting insight was that if the target coefficient could be defined precisely enough, the AI could first locate the relevant regression specification and then extract the associated numerical details more accurately. His initial prompt instructed Sysrev to read the full paper and extract coefficients from all regression tables where the dependent variable was a measure of subjective well-being and inflation entered the regression as an explanatory variable.
Through iterative testing and refinement with ChatGPT, Allen made several important revisions. First, he tightened the coefficient definition to exclude specifications where inflation appeared in an interaction term or polynomial term, since in those cases the reported coefficient does not represent a clean linear inflation effect. Second, he revised the prompt to evaluate eligibility at the level of each individual regression specification rather than assuming that regressions were always displayed as columns — a consequential change, since some papers present regressions in rows, panels, or stacked formats. Third, and perhaps most significantly, he restructured the search logic so that Sysrev would first scan the entire paper for all regression specifications containing an inflation variable, and only then filter by the outcome and the standalone requirement. He also added an explicit instruction requiring the model to review all numbered tables, appendices, and continuation tables before returning any result.
Allen's results are shown in Table 3. His performance on the training papers (Papers 1–5) was strong: success rates of 100%, 90%, 95%, 100%, and 100%, for an overall training success rate of 98%. On the held-out test papers (Papers 6–15), performance was more variable. Most papers fell in the 73–100% range, but Paper 8 was a notable outlier at just 7%. Excluding Paper 8, Allen's out-of-sample performance was quite respectable. Including it, his overall test success rate was 67%.

Anne's approach and results
Anne's approach to data extraction followed a similar iterative logic. She created 10 child labels in Sysrev, covering publication year, table number, column number, sample size, data period start and end years, standard error, coefficient, and t-statistic. She used ChatGPT to help develop and refine each label prompt, with the primary objective of extracting data from regression tables — specifically from specifications estimating the effect of objective inflation on global subjective well-being — rather than from narrative sections of the text.
Testing proceeded paper by paper. Her initial prompt matched the manual coding perfectly on Paper 1, but produced mismatches on Paper 2, signaling that further refinement was needed. She revised the prompts and reapplied them to both papers, repeating this process through Paper 5. After several rounds of adjustment, she felt confident in a prompt that achieved 98% overall success on the training set — identical to Allen's training performance.
Anne's out-of-sample results, however, were considerably weaker than Allen's. As shown in Table 4, her success rates on Papers 6–15 ranged from 0% (Paper 7) to 100% (Paper 12), with an overall test success rate of 41%. This underscores that achieving high accuracy on a small training set does not guarantee that a prompt will generalize to papers with different formats and reporting styles. This is a version of a well-known problem in machine learning — overfitting — applied to the domain of prompt engineering.

What explains the difference in out-of-sample performance?
Both RAs achieved nearly identical in-sample success rates (98%) but diverged sharply in out-of-sample performance (Allen 67%, Anne 41%). The most likely explanation is the difference in how each student structured the search logic within their prompts. Allen's key insight was to separate the search phase from the filtering phase: instruct the model to first scan the entire paper for all regression specifications containing an inflation variable, and only then apply the inclusion criteria. This two-stage logic made the prompt more robust to variation in how papers present their results — different table layouts, appendices, continuation tables, and so on. Anne's prompt, while carefully calibrated on the training papers, appears to have been more sensitive to the specific formats and conventions of those papers, and therefore less able to generalize.
Paper 8 presents an interesting special case: both RAs scored just 7% on it. Sysrev’s poor performance on this paper may be related to two features of this paper. First, it had unusually formatted tables. Second, it was a text-based pdf (i.e. a Word document that had been converted to pdf). This kind of paper-specific failure is worth noting because it illustrates that even a well-designed extraction prompt may encounter papers that fall outside the range of formats it was trained on.
Reflections on the Process
Several lessons emerge from this exercise that are worth stating explicitly for researchers considering a similar approach.
First, title and abstract screening and data extraction are quite different tasks, and performance on one does not predict performance on the other. Both Anne and Allen performed well on screening, but Anne underperformed Allen on out-of-sample data extraction. The skills required to write a good screening prompt — careful attention to boundary cases, symmetric treatment of inclusion and exclusion errors — are not the same as the skills required to write a good extraction prompt, which depend more on understanding how to structure search logic across varied document formats.
Second, the iterative prompt development process is genuinely important and should not be rushed. Both RAs improved their prompts substantially through the practice rounds, and in both cases the refinements that mattered most were those that addressed specific, identified failures rather than general improvements to the prompt language. Using ChatGPT to assist in this process was valuable, but the diagnostic work — identifying which papers were misclassified or mis-extracted, and why — required careful human judgment.
Third, out-of-sample performance is the only performance metric that matters for the actual meta-analysis. Both RAs achieved near-perfect in-sample accuracy, but their out-of-sample results were considerably more variable. This gap is a reminder that prompt engineering, like model training, is subject to overfitting: a prompt that is too closely tailored to the idiosyncrasies of the training papers will fail to generalize. Researchers using AI-assisted extraction should treat their training success rates with appropriate skepticism until those rates are confirmed on held-out papers.
Fourth, and perhaps most importantly, AI-assisted screening and extraction are tools for increasing efficiency, not for replacing judgment. Neither student's prompt performed perfectly, and in both cases the failures were informative — they revealed specific features of the literature (unusual abbreviations, non-standard table formats, domain-specific vocabulary) that required deliberate handling. A researcher who simply ran Sysrev's auto-labeler without the careful diagnostic process described here would have obtained much worse results, and might not have known it.
In the next and final blog in this series, we will reflect on the overall workflow — from initial literature searching through screening and data extraction — and offer some broader conclusions about where AI-assisted tools add genuine value in the meta-analytic process and where human judgment remains indispensable.
I should note that there are a couple of other tools out there called Sysrev that might cause some confusion. For those interested in the tool that we used, it can be found at www.sysrev.com.